Project 14:
Electric Vehicle Bus Systems
Objective
Investigate the implementation strategy and the operation of an electric bus fleet and compare the operational data with a baseline diesel bus fleet. Model an electric public bus transportation system in a selected city.
Brief Description
Pure electric buses (EBs) present an alternative in the transit bus arena and are being manufactured and sold by several US companies. In this project, an electric bus fleet (Tallahassee StarMetro's five electric bus fleet) was investigated as a case study. For the study, the implementing strategy, route distance and timing, charging times, fuel economy, impact of type of chargers, maintenance and operational characteristics of the EB fleet were analyzed and the results were compared with the StarMetro diesel bus fleet. The operational results showed that the electrical demand charge was a large contributor to the electricity costs. Thus, an energy consumption model was developed to simulate the fuel economy of the EBs for any given driving cycle. The model was then used to study the impact of routes and EB charging strategies on demand charges. An objective function was created to search for the optimal charging strategy that opts to minimize demand charges. The EB charging strategy showed that optimizations based on the battery state of charge will result in a 41% electricity cost savings for a five EB fleet over 12 years operational period. The EB charging strategy can be easily adopted by transit agencies without added hardware costs. Future project activities will be to apply the EB energy consumption model and the charging strategy model to different electric transit bus systems with different driving cycles and routes.
Research Results
The Tallahassee StarMetro has been operating five model EcoRideTM BE-35 battery electric buses (EB) manufactured by Proterra since 2013. These buses were equipped with Altairnano lithium titanate 72 kWh battery packs and regenerative braking system. EBs are fast-charged by way of a Proterra FastFillTM charging station installed in a designated location in the route where the electric buses operate. The charging station is comprised of a 500 kW charger, a charger head, and a communication system. Typical charge time from 10% to 95% state of charge is about 10 minutes.
The EBs operational data including miles travelled, energy consumption, electricity cost, maintenance record, and out of service reasons have been collected and analyzed. The results show that between July 2013 and July 2014, the average monthly mileage for the EB and the baseline diesel buses were 980 miles and 3495 miles, respectively. The average electricity-mileage of the electric buses was 2.5 kWh/mile, four times greater than that for diesel bus which was 9.6 kWh/mile. The average monthly maintenance cost for the electric buses during July 2013 to March 2014 period was $979, which is lower than the monthly maintenance cost of the baseline diesel buses of $1,469.
This case study showed that the fast charging resulted in high utility demand charges which contributed to the largest part of the electric fuel cost and, thus, caused a major challenge in the adoption of electric buses. Demand charge is a utility fee based on the peak power used during a given billing cycle (normally one month). The demand charge is calculated as the peak demand (measured in kW) multiplied by a demand charge rate ($/kW). Utility companies measure the average power delivered in a 15 or 30 min window, and the peak demand is identified as the highest power during a billing cycle. (Tallahassee uses a 30 minute window for the time period)
For this research effort, a Matlab computer model was developed to simulate the energy consumption and charging behaviors of the EBs for any given driving cycle. The model was then used to study the impact of routes and EB charging strategies on demand charges. An objective function was created to search for the optimal charging strategy that results in minimizing demand charges. A case study was conducted on the Tallahassee EB fleet which showed the optimized charging strategy results in a 41% savings for a five EB fleet over 12 years operational period. The EB charging strategy can be easily adopted by transit agencies without added hardware costs.
The flow chart of the charging strategy is illustrated in Figure-1. Briefly, every time an EB arrives at the fast charger (FC), the model checks the State of Charge (SoC). If the SoC is below a charging threshold (CT), the EB is charged to 95% SoC. If the SoC is above the CT, the model determines if the remaining SoC is sufficient to allow the EB to travel back to the FC in the next trip. If the EB can complete the following segment and return to the charging station with an SOC above 5%, then the EB will skip the charging. Otherwise, the EB charges to 95% SoC at the FC. Figure-2 shows a comparison of demand profiles for a one day period.

Figure 1. Schematic representation of the charging model.
The first plot is the measured data, the second is the model data without optimization, and the third is the model data with optimization. One can see that the highest measured peak is 200 kW (which is used to determine the demand charge). In the third plot, the optimized demand profile, the peak is 134 kW or 35% lower. The reason for this lowering of demand is that the program evenly distributed the charging events throughout the day so the energy dispatched every 30 minutes was lowest.
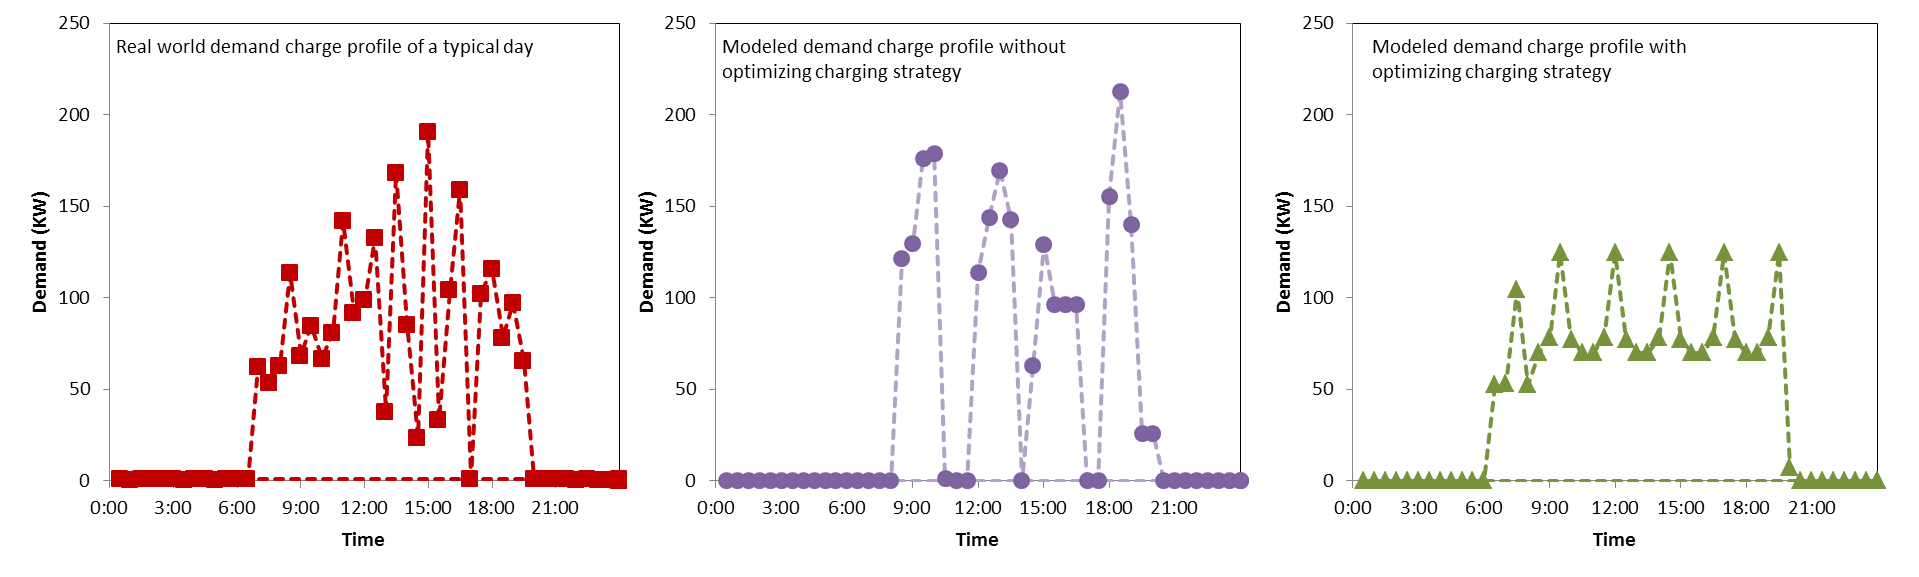
Figure 2: Comparison of real world and modeled demand profiles.
For the Tallahassee system this can be achieved by charging the electric buses when the SoC is below 60% charging threshold. Therefore, by simply adopting an optimized charging strategy, the demand charges can be reduced up to 45%.
Other project work evaluated how many EBs can be accommodated by one fast charger in a given route and ridership, and how fleet sizes affect demand charges. For lithium titanate based EB systems, fast charging stations are an essential and expensive component. The capital and installation cost of the fast charger in Tallahassee was $1.165 million. As a result, early adopters of EBs will likely start with only one fast charger. These results showed that, in the case of StarMetro's current route, 13 EBs is the theoretical maximum that one fast charger can accommodate. The average demand charge costs per bus generally decrease with increased fleet size.
Impacts/Benefits
High electrical demand charges are recognized as one of the major obstacles to the wide adoption of electric buses. To reduce demand charges, approaches such as increasing electric bus efficiency, improving energy transfer mechanism, or temporarily suspending demand charges have been proposed. However, most of these strategies require major technical breakthroughs or policy changes. The demand reduction model developed by this project has shown that the use of an optimized charging strategy based on battery SOC can significantly reduce demand charges without any new technology improvement or policy change, and can be adopted at no additional cost to the transit agencies.
Reports
N. Qin et al. “Numerical Analysis of Electric Bus Fast Charging Strategies for Demand Charge Reduction”, Transportation Research Part A: Policy and Practice, (2016), 94, 386-396 http://dx.doi.org/10.1016/j.tra.2016.09.014
N. Qin et al. "Electric Bus Systems", Electric Vehicle Transportation Center, Florida Solar Energy Center, FSEC Report No. FSEC-CR-2060-17, April 2017.
Project Title: University: Principal Investigator: PI Contact Information: Florida Solar Energy Center Funding Source: City of Tallahassee Total Project Cost: Agency ID or Contract Number: Start date: End date: |